

A typhoon tracker for Mac should do more than place another weather page in a browser tab. It should make an active storm easy to recognize, keep its latest observed center in view, and fit naturally into the desktop you already use.
LiveAtlas approaches typhoon tracking as a living satellite wallpaper. From the menu bar, you can find an active tropical cyclone, select it, and let LiveAtlas move the satellite view to the part of Earth where the storm is currently located. The result is a focused typhoon cloud map on your Mac desktop, with optional storm details displayed directly on the wallpaper.
This guide explains how LiveAtlas Typhoon Tracking works, what information it shows, and where its role ends.
What LiveAtlas Typhoon Tracking Actually Does
LiveAtlas follows the latest reported center of an active tropical cyclone. When you select a storm, the app:
- loads the current list of active tropical cyclones;
- shows the storm name, identifier, center coordinates, wind speed, pressure, and update time when those fields are available;
- chooses a suitable geostationary satellite view for the storm's location;
- centers the wallpaper composition around the latest observed storm center;
- refreshes the storm list and satellite imagery on your chosen schedule;
- optionally adds a compact typhoon information overlay to the wallpaper.
In other words, LiveAtlas is a satellite typhoon tracker designed for the macOS desktop. It combines current storm-position data with cloud imagery instead of presenting a conventional forecast chart.
From JTWC / TCGP Data to the Mac Desktop
The active-storm list used by LiveAtlas is based on current tropical cyclone guidance data published through the UCAR Tropical Cyclone Guidance Project, commonly identified in the app as JTWC / TCGP data.
For each active storm, LiveAtlas reads the latest available observed position and supporting fields. The app then turns that information into something immediately visual: a desktop wallpaper centered on the storm.
This separation matters. The storm record answers “where is the latest reported center?” Satellite imagery answers “what does the surrounding cloud system look like?” LiveAtlas brings the two together without pretending that a cloud image is a forecast.
You can also inspect the current tropical cyclone guidance directory directly if you want to see the public source behind the active-storm list.
1. Find Active Tropical Cyclones from the Menu Bar
Typhoon Tracking is built into the LiveAtlas menu bar workflow. You do not need to search for a storm on a separate website, copy coordinates, or manually choose a satellite.
Open the LiveAtlas dashboard and enter the Typhoon Tracking section. The app lists active tropical cyclones currently available from its data source. Each row is designed to help you distinguish storms quickly, especially when more than one system is active in the same ocean basin.
Depending on the available record, the list can include:
- official storm name or identifier;
- basin and storm number;
- latitude and longitude of the latest center;
- maximum sustained wind in knots;
- minimum central pressure in hPa;
- time of the latest track update.
This makes the feature useful as an active storm tracker for Mac users who want a concise status view without keeping a dense forecasting dashboard open all day.
2. Select a Storm and Let LiveAtlas Follow It
Choose a storm from the list and LiveAtlas switches the wallpaper region to Typhoon Tracking mode. The selected cyclone becomes the focus of the desktop view.
The important detail is that LiveAtlas follows the storm by its current identity and most recent center, not by a fixed map preset. When new source data becomes available, the app can refresh the center used for the wallpaper composition.
If a selected storm is no longer present in the active list, LiveAtlas does not abruptly replace your desktop with an unrelated region. It keeps the current wallpaper until you choose another storm or switch to a different Earth view.
That behavior makes typhoon tracking feel like a desktop feature rather than a web page that happens to be open in the background.
3. Match the Storm to the Right Satellite View
No single geostationary satellite provides the best view of every ocean. LiveAtlas uses the storm's coordinates to select an appropriate supported source, such as Himawari, GOES-West, or GOES-East.
For a western Pacific typhoon, the app will normally favor imagery suited to that region. For a cyclone farther east across the Pacific or over the Atlantic side of the supported coverage, it can choose a different satellite view.
This automatic matching removes a surprisingly technical step. A user looking for real-time typhoon satellite imagery should not need to memorize satellite footprints before seeing the storm.
Coverage still depends on the geographic reach and availability of the supported satellite sources. If a storm is outside that coverage, LiveAtlas cannot manufacture imagery that the source does not provide.
4. Turn the Current Storm Center into a Live Wallpaper
After choosing the satellite, LiveAtlas composes the imagery around the latest storm center and applies it as a live typhoon tracking wallpaper.
The desktop view is intentionally visual. Spiral cloud bands, the central dense overcast, an emerging eye, and the storm's relationship to nearby land can often be easier to understand at a glance than in a row of numbers.
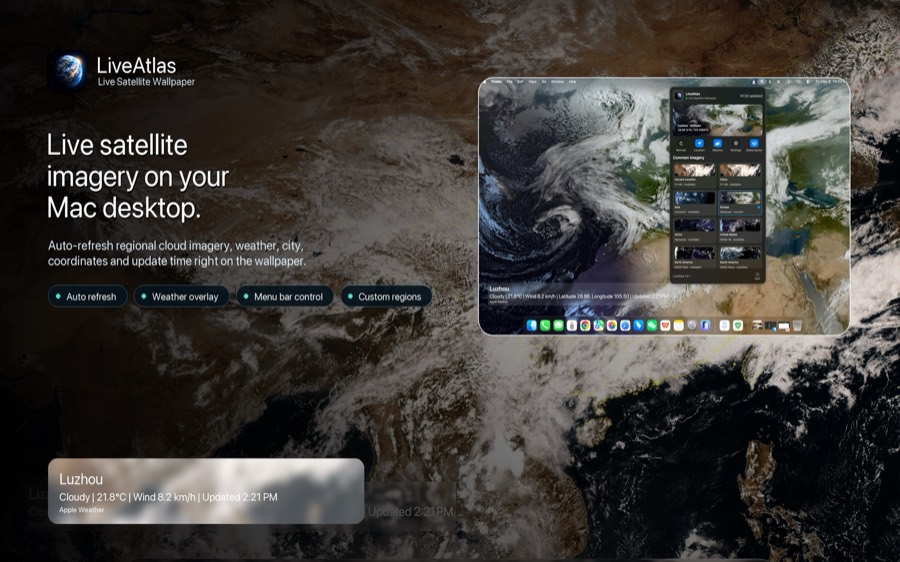
This is where LiveAtlas differs from a typical tropical cyclone tracker for macOS. It is not just a utility window. The satellite view becomes part of the desktop itself, so you can notice changes naturally as you work.
The goal is not constant interruption. It is ambient awareness: useful information placed in a surface you already see.
5. Add Storm Context to the Wallpaper
Satellite imagery is compelling, but context prevents it from becoming a purely decorative cloud map. LiveAtlas can place a compact information overlay on the wallpaper with details such as:
- storm name and identifier;
- latest center coordinates;
- maximum sustained wind in knots;
- minimum central pressure in hPa;
- track-data update time;
- satellite-image time.
The two timestamps are especially useful because storm position data and satellite imagery are produced on different schedules. Showing them separately helps you understand the freshness of each layer instead of implying that everything was captured at exactly the same moment.
You can keep the overlay on when you want a more informative desktop or turn it off for a cleaner satellite wallpaper.
Refresh Intervals and What “Live” Means
LiveAtlas offers typhoon-list refresh intervals of 10, 30, 60, or 120 minutes, along with a manual refresh option. Satellite wallpaper updates follow the app's related image-refresh behavior and source availability.
Here, “live” means automatically refreshed from the latest data available to the app. It does not mean a continuous video feed, second-by-second radar, or an instantaneous storm-center fix.
There can be a delay between the real atmosphere, the satellite observation, the published storm record, and the moment your Mac downloads the newest material. The update times shown in LiveAtlas are therefore more meaningful than a vague promise of “real time.”
What LiveAtlas Does Not Replace
LiveAtlas Typhoon Tracking is a visual observation feature, not an official forecast or emergency-warning service.
It does not currently draw a forecast cone, predicted track line, arrival-time map, or evacuation zone. It follows the latest observed storm center available from its source. That is a deliberate product boundary and an important distinction for anyone comparing it with a dedicated meteorological forecast platform.
For safety decisions, warnings, watches, evacuation instructions, or expected local impacts, always use the official meteorological and emergency-management services for your location.
LiveAtlas is best understood as a live typhoon cloud map for the desktop: a way to observe an active system, keep its current location in view, and explore the satellite structure around it.
How to Use Typhoon Tracking in LiveAtlas
The workflow is short:
1. Open LiveAtlas from the macOS menu bar.
2. Open Typhoon Tracking.
3. Refresh the active-storm list if needed.
4. Select the tropical cyclone you want to follow.
5. Choose whether to display the typhoon information overlay.
6. Set a refresh interval that suits your workflow.
Typhoon Tracking is a premium LiveAtlas feature. A subscription or other eligible purchase may be required, depending on the options currently offered in the app.
Who Is This Feature For?
A typhoon tracker for Mac can be useful to more than professional meteorologists.
It is a natural fit for:
- weather and satellite-imagery enthusiasts;
- people living in typhoon- or hurricane-prone regions;
- developers, designers, and desk-setup fans who want useful ambient information;
- educators and students discussing tropical cyclone structure;
- creators who want a visual starting point before consulting formal forecast material;
- anyone who prefers a focused menu bar app over a permanent browser dashboard.
The feature is particularly appealing if you already use LiveAtlas for Earth imagery and want the desktop to shift from a general planetary view to a specific active storm when it matters.
A Better Way to Read a Storm from the Desktop
Numbers describe intensity and position. Satellite imagery reveals structure. A useful typhoon tracking experience needs both, while remaining honest about the difference between observation and prediction.
LiveAtlas keeps that balance simple: choose an active cyclone, follow its latest reported center, see the surrounding cloud field, and add just enough context to understand what is on the screen.
For more background, explore the LiveAtlas typhoon satellite tracker topic or see how an individual storm can be interpreted in this satellite view of Typhoon Bavi.
Download LiveAtlas
Turn your Mac desktop into a live view of Earth and follow active tropical cyclones with LiveAtlas.
https://apps.apple.com/us/app/liveatlas-live-earth/id6762602057