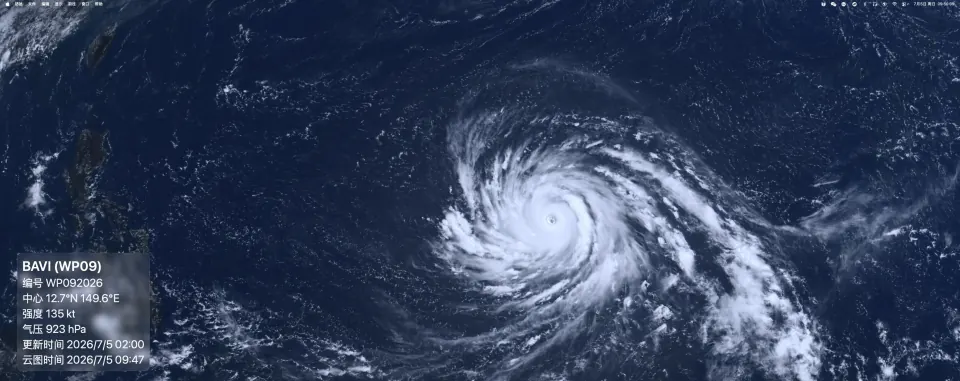
On the morning of July 5, 2026, Typhoon Bavi (BAVI / WP09) appeared in LiveAtlas with a sharply defined eye over the western North Pacific. The screenshot data shows the center near 12.7°N, 149.6°E, an intensity of 135 kt, a central pressure of 923 hPa, and a satellite image time of 2026/7/5 09:47.
This is not just a bright swirl of cloud. It is a highly organized tropical cyclone with a concentrated core. The most striking feature is the nearly circular eye, surrounded by a dense eyewall. Closer to the center, the cloud structure becomes tighter; farther out, spiral rainbands curve into the storm like channels feeding moisture and momentum into the core.
Why the typhoon eye matters
A visible eye usually means the storm has become highly organized. In an intense typhoon, the strongest convection and most violent winds are concentrated around the eyewall. Inside the eye, air tends to sink and cloud cover is reduced, which is why the eye can look darker and cleaner in visible satellite imagery.
Bavi’s structure in this image is a textbook example: a small, round eye, a complete eyewall, and spiral bands extending outward. Those visual signals show that this was not a newly formed tropical storm, but a mature typhoon in a very intense phase.
China Weather reported on July 4 that Bavi had strengthened into a super typhoon. At 05:00, its center was about 710 km east-southeast of Saipan, Guam, with maximum winds near the center at Force 17 and a minimum central pressure around 920 hPa. The same report said it was not expected to affect Chinese waters before July 8.
By July 5, public tropical cyclone advisories from NWS Guam still described Bavi as a dangerous typhoon system moving toward the Mariana Islands. Agencies may use different wind averaging periods, update cycles, and classification language, so decisions about travel, marine activity, or emergency preparation should always follow the latest official warnings from local meteorological and emergency authorities.
What one satellite image can tell us
The value of satellite imagery is not only that it looks dramatic. It reveals the scale and structure of weather systems in a way icons and forecast summaries cannot.
In Bavi’s case, the image shows three useful layers of information.
First, the eye and eyewall reveal the storm’s core structure. A clearer eye usually indicates a more organized system.
Second, the outer spiral bands show moisture transport and the broader circulation. A typhoon’s impact is not limited to the center point; outer rainbands often shape the wind and rain experienced over a much wider area.
Third, the storm’s position relative to islands and surrounding waters helps explain track risk. The western Pacific island chain is visible on the left side of the screenshot. Bavi was still over open water, but close enough to the Mariana Islands that official advisories mattered.
That is the difference between a weather icon and a satellite image. An icon tells you there is a typhoon. A satellite image shows what the typhoon looks like, how it is organizing, and how it relates to the surrounding region.
Why this belongs in LiveAtlas
LiveAtlas is not a warning system, and it does not replace professional weather services. It is more like a quiet desktop window into Earth, bringing real satellite cloud imagery to the Mac so large-scale atmospheric changes can remain visible while you work.
A storm like Bavi is exactly the kind of scene LiveAtlas is built to show. You do not need to keep refreshing a web page or leave a complex weather site open all day. The desktop wallpaper updates with satellite imagery, letting the eye, eyewall, rainbands, and surrounding cloud fields appear naturally in your workspace.
The latest version of LiveAtlas also adds typhoon information overlays. For weather enthusiasts, that turns satellite imagery from a beautiful background into a more contextual Earth observation layer: where the storm is, where the center is located, and what kind of structure the system currently shows.
For safety-critical decisions such as travel, marine operations, disaster preparation, or emergency response, always rely on official warnings and local emergency agencies. LiveAtlas is meant to make real satellite imagery easier to see, easier to live with, and better suited for long-term observation.
References
NWS Guam Public Tropical Cyclone Advisory, July 5, 2026:
https://forecast.weather.gov/product.php?issuedby=PQ1&product=TCP&site=gum
China Weather: “Bavi” strengthens into a super typhoon, no impact on Chinese waters before July 8, 2026-07-04:
https://news.weather.com.cn/2026/07/4701593.shtml
CIMSS Satellite Blog: Super Typhoon Bavi rapidly intensifies to a Category 5 storm east of Guam:
https://cimss.ssec.wisc.edu/satellite-blog/archives/71044