Typhoon Jangmi from Space: What Satellite Cloud Images Reveal About a Tropical Storm
Typhoons are among the most powerful and visually striking weather systems on Earth. From the ground, they are experienced as strong winds, heavy rain, rough seas, and rapidly changing weather. But from space, a typhoon becomes something different: a vast rotating cloud system with structure, motion, and atmosphere-wide scale.
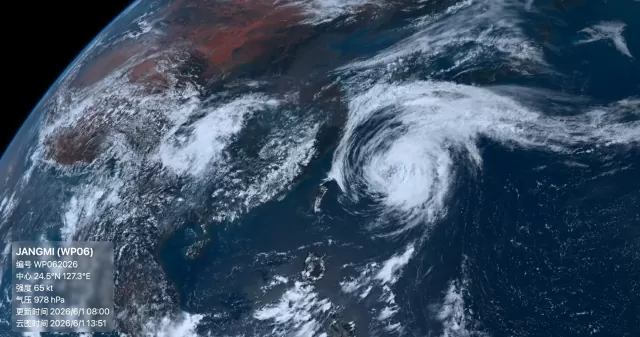
The satellite image of Typhoon Jangmi, also identified as WP06, offers a useful example of how tropical cyclones can be understood through cloud imagery.
In the image, Jangmi is located over the Northwest Pacific near East Asia. The displayed storm information shows a center near 24.5°N, 127.3°E, with an estimated intensity of 65 kt and central pressure around 978 hPa. These values suggest a compact but organized tropical cyclone, strong enough to show clear rotation and spiral cloud structure in satellite imagery.
What Makes Typhoon Jangmi Interesting in Satellite Images?
Typhoon Jangmi is interesting because its cloud structure is visible without needing complex meteorological tools.
At first glance, you can already see several important features:
* a rotating cloud mass over the ocean
* curved spiral bands wrapping around the center
* a brighter central cloud area
* surrounding cloud streams extending outward
* clear contrast between ocean, land, and storm clouds
This makes Jangmi a good case for explaining how to read typhoon satellite images.
Satellite cloud images are not only beautiful. They show how the storm is organized and how it interacts with the surrounding atmosphere.
Understanding the Storm Center
Every tropical cyclone has a low-pressure center. In strong typhoons, this center may develop a clear eye. In weaker or developing systems, the center may be covered by dense clouds instead.
In the Jangmi image, the storm shows a strong rotating structure, but the center appears mostly cloud-filled rather than having a sharply defined open eye. This is common for storms that are still organizing, changing intensity, or affected by surrounding atmospheric conditions.
A cloud-filled center does not mean the storm is harmless. It simply means the inner core is not showing a classic clear eye in this image.
When reading a typhoon satellite image, the center is important because it tells us where the storm’s circulation is focused. The tighter and more symmetrical the clouds are around the center, the more organized the storm usually appears.
Spiral Cloud Bands: The Signature of a Typhoon
One of the most recognizable signs of a typhoon is its spiral cloud bands.
In Jangmi’s satellite image, curved cloud arms wrap around the storm center. These bands are created as warm, moist air flows inward and rotates around the low-pressure system. As the air rises, clouds and thunderstorms form along the spiral structure.
Spiral bands are important because they show:
* the direction of rotation
* how organized the storm is
* where rain and squalls may extend
* how far the storm’s influence reaches
* whether the cyclone is becoming more symmetrical
A well-organized tropical cyclone often has bands that curve smoothly into the center. If the bands are broken, uneven, or stretched to one side, it may suggest wind shear or other environmental interference.
Why the Cloud Shape Matters
The shape of a typhoon tells a story.
A rounder and more symmetrical cloud shield often indicates a better-organized storm. A lopsided shape may suggest that the storm is being affected by wind shear, dry air, land interaction, or cooler ocean waters.
In the case of Jangmi, the satellite view shows a concentrated central cloud area with spiral structure, but also some unevenness around the outer cloud field. This kind of image helps viewers understand that typhoons are not static objects. They are constantly changing systems.
Each satellite image is a snapshot. A loop of images over time would reveal whether Jangmi is strengthening, weakening, moving northwest, expanding, or becoming less organized.
What Do 65 kt and 978 hPa Mean?
The information panel in the image lists Jangmi’s intensity as 65 kt and pressure as 978 hPa.
In tropical cyclone monitoring, wind speed and pressure are two key indicators.
65 kt means the estimated sustained wind speed is around 65 knots. This places the storm in typhoon-level intensity by common western North Pacific classification standards.
978 hPa refers to the estimated central pressure. Lower pressure generally indicates a stronger cyclone, although pressure alone does not tell the whole story. Storm size, wind field, structure, and environmental conditions also matter.
Satellite imagery helps connect these numbers to visible structure. A stronger storm often shows tighter rotation, colder cloud tops, deeper convection, and sometimes a clearer eye.
Why Satellite Images Are Essential for Typhoon Tracking
Many typhoons spend most of their life over the ocean, far from land-based weather stations. This is why satellite imagery is essential.
Satellites help monitor:
* storm formation
* cloud organization
* movement direction
* spiral band development
* eye or inner-core changes
* cloud-top temperature
* interaction with land
* weakening or strengthening trends
For a storm like Jangmi, satellite images allow people to see the system as a whole instead of only reading numbers from a forecast table.
This visual perspective is especially useful for weather enthusiasts, educators, app developers, and anyone interested in Earth observation.
How to Read Typhoon Jangmi’s Satellite Cloud Image
When looking at the Jangmi image, a beginner can follow a simple process.
First, locate the storm center. Look for the main rotating cloud mass and the area where the spiral bands curve inward.
Second, observe symmetry. Is the storm round and balanced, or stretched to one side?
Third, look at the cloud brightness and texture. Bright, dense clouds often indicate stronger convection, while thinner clouds may show outer bands or upper-level outflow.
Fourth, follow the spiral bands. These reveal the storm’s rotation and the reach of its rain-producing areas.
Finally, compare multiple images over time. A single image is useful, but a sequence shows the storm’s evolution.
Why Typhoons Look So Dramatic from Space
Typhoons are visually dramatic because they reveal the atmosphere’s motion at a massive scale.
From space, clouds become visible traces of wind, moisture, pressure, and heat. The ocean provides energy. The atmosphere organizes that energy into rotation. The satellite image captures the result: a living weather system, sometimes hundreds of kilometers wide.
This is why typhoon imagery is both beautiful and serious. It can be visually stunning, but it also represents real hazards for people, ships, coastlines, and cities.
Watching Earth’s Weather More Closely
Satellite cloud imagery helps us understand that weather is not just local. A cloudy day, a storm offshore, or a typhoon near the ocean is part of a larger atmospheric system.
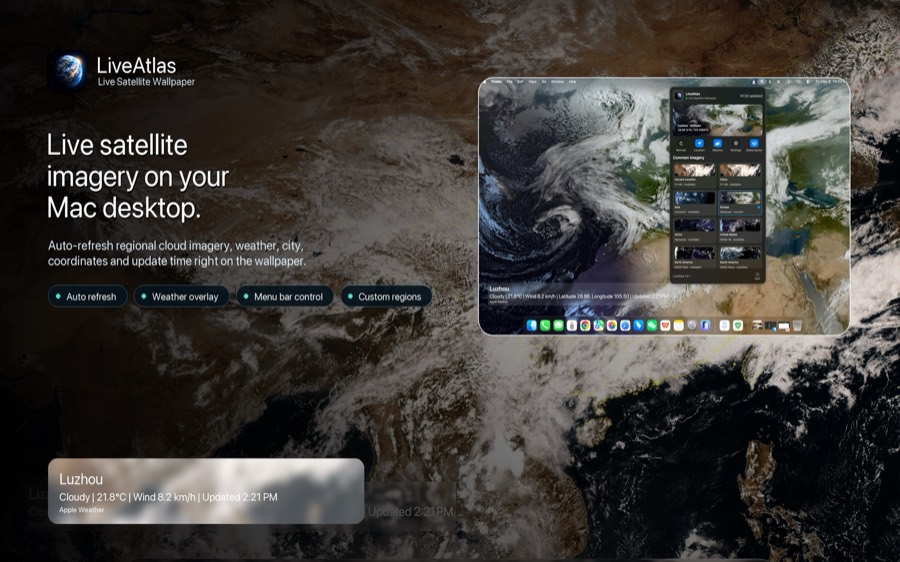
Tools like LiveAtlas are built around this sense of connection. By bringing satellite cloud imagery to the Mac desktop, LiveAtlas lets users observe Earth’s changing atmosphere in a quiet, visual way. It is not a forecasting tool, but it can make satellite imagery feel more accessible and more present in daily life.
For people who enjoy watching cloud patterns, typhoon systems, and Earth from space, this kind of visual experience can make the desktop feel connected to the real planet.
Final Thoughts
Typhoon Jangmi is a good example of how satellite cloud images can reveal the structure of a tropical cyclone.
From its spiral bands to its central cloud mass, the image shows how a typhoon organizes itself over warm ocean waters. The storm data, including its location, wind intensity, and central pressure, adds context to what we see from space.
To understand a typhoon satellite image, look for:
* the storm center
* spiral cloud bands
* symmetry or asymmetry
* dense central clouds
* signs of an eye or cloud-filled core
* changes over time
The more you observe, the easier it becomes to see patterns.
A typhoon is not just a storm on a map. From space, it is a powerful, rotating system that shows the atmosphere in motion.