

At 2:00 p.m. on July 27, Typhoon Dolphin formed over the remote western North Pacific as the 13th typhoon of 2026. Its name was contributed by Hong Kong, China, and refers to the Chinese white dolphin found in Hong Kong waters.
The gentle name was soon attached to a dramatic change in the atmosphere.
At 8:00 a.m. on July 28, the China Meteorological Administration reported maximum winds of 28 meters per second and a minimum central pressure of 982 hPa. By 5:00 a.m. on July 29, Dolphin had rapidly intensified into a super typhoon, with maximum winds of 58 meters per second and a central pressure of 925 hPa.
In less than a day, its reported maximum wind speed had almost doubled.
Those numbers describe intensity. Satellite images show what that transformation looks like: a loose tropical system becoming rounder, more organized, and increasingly dominated by a compact inner core.
Start with symmetry, not the eye
When reading a typhoon satellite image, the most obvious feature is not always the best place to begin. Before looking for an eye, look at the storm as a whole.
Is the central cloud mass becoming circular? Are the deepest thunderstorms wrapping around the same center? Or has the strongest convection been pushed to one side?
Powerful tropical cyclones often develop a more symmetric shape as their circulation becomes vertically aligned. NOAA's guide to hurricane satellite imagery notes that low vertical wind shear tends to support a rounder storm, while stronger shear can distort the circulation and displace thunderstorms away from the center.
For Typhoon Dolphin, the useful observation is therefore not a single spectacular frame. It is the transition visible across a sequence of images: the central dense overcast consolidating, curved bands wrapping more tightly inward, and the inner core becoming easier to identify.
This is one reason a satellite animation or a regularly refreshed typhoon cloud map is more informative than an isolated screenshot.
The eye is only one part of the story
The eye is the feature most people recognize in an intense typhoon. It appears as a relatively clear area near the center of the circulation, sometimes surrounded by an almost perfect ring of bright cloud.
But the eye itself is not where the strongest surface winds are found. The most violent winds and deepest convection are concentrated in the eyewall surrounding it.
As a tropical cyclone becomes better organized, air descends inside the eye and suppresses clouds there. Around that clearing, air rises rapidly through towering eyewall thunderstorms. On infrared imagery, these very high, cold cloud tops often appear especially bright.
A clearing and increasingly well-defined eye can be an important sign that the inner core is becoming more organized. It should not, however, be treated as a do-it-yourself intensity meter.
Professional estimates combine multiple satellite channels, pattern-recognition techniques, numerical guidance, surface observations, and other available data. A visible eye is a structural clue, not enough evidence for an untrained viewer to assign a wind speed or forecast the storm's next move.
What spiral rainbands reveal
Long bands of thunderstorms often curve around a typhoon and spiral toward its center. These spiral rainbands create the familiar pinwheel shape seen in many satellite views.
They also remind us that a typhoon is much larger than the small center marker shown on a track map.
Rainbands help reveal the scale and organization of the circulation. A tightening curved band can indicate that convection is becoming more closely connected to the center. Outer bands may stretch hundreds of kilometers away, carrying showers, thunderstorms, and gusty winds far from the eye.
That does not mean every bright cloud in a satellite image can be translated directly into rainfall at the surface. Visible imagery mainly records reflected sunlight, so it works best during daylight. Infrared imagery measures emitted radiation and is available both day and night; colder, higher cloud tops are generally displayed more brightly.
Neither type of image, on its own, tells you exactly how much rain will fall in a particular city. Satellite imagery is best used to understand structure and evolution, while local forecasts, radar, gauges, and official warnings provide the information needed for safety decisions.
Why rapid intensification is easier to understand as a sequence
Rapid intensification is a process, not a single appearance.
A storm can look disorganized, develop a dense central cloud shield, open a small eye, and reorganize again within a short period. One frame may capture the eye at its clearest. Another may show high cloud temporarily covering it even while the circulation remains powerful.
When comparing consecutive typhoon satellite images, ask a few simple questions:
- Is the central cloud mass becoming more symmetric?
- Is the eye clearing, shrinking, or becoming obscured again?
- Are curved bands wrapping more tightly into the inner core?
- Is the deepest convection balanced around the center or displaced to one side?
- Do the satellite image time and the storm-position update time actually match?
These questions cannot replace meteorological analysis, but they move the viewer from merely seeing a typhoon to noticing how it is changing.
Typhoon Dolphin is a particularly striking example because the official intensity figures changed so quickly. The falling central pressure and rising maximum wind speed provide the numerical record; the evolving cloud structure provides the visual narrative.
Observing Typhoon Dolphin from a Mac desktop
This is the kind of event that inspired Typhoon Tracking in LiveAtlas.
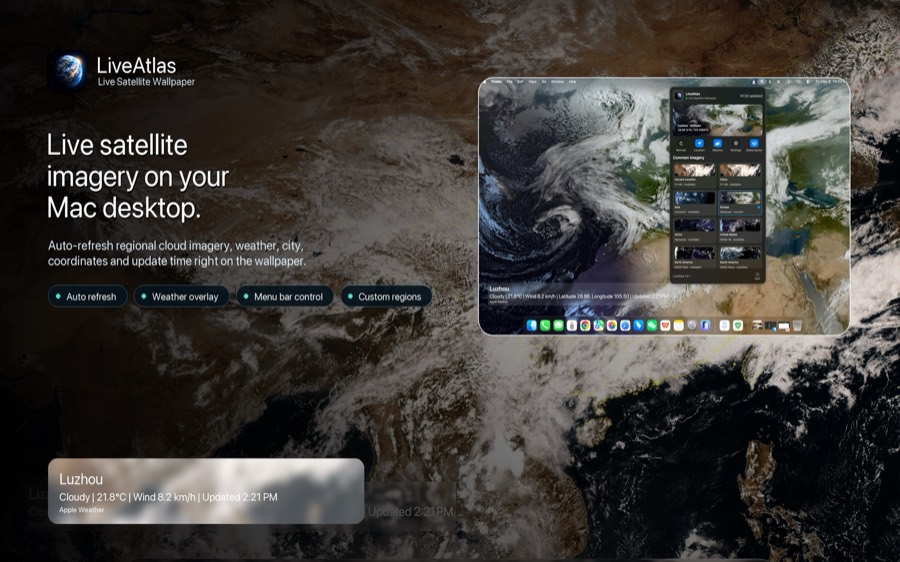
Select an active tropical cyclone and LiveAtlas follows its latest available reported center, chooses a supported geostationary satellite view for the location, and turns the surrounding cloud field into an automatically updating macOS wallpaper.
An optional information overlay can show the storm name, coordinates, maximum wind, minimum pressure, track-data update time, and satellite-image time when those fields are available. Keeping the two timestamps separate matters: storm-position data and satellite imagery are published on different schedules and should not be assumed to represent the same instant.
The aim is ambient observation rather than constant interruption. Instead of leaving a dense tracking page open all day, you can keep the cloud system visible in the background and notice structural changes as you work.
The promotion ends at an important boundary: LiveAtlas is a satellite visualization and latest-position observation tool. It is not an official forecast, warning, forecast-cone, or emergency-management service.
For watches, warnings, evacuation instructions, travel decisions, and expected local impacts, always follow the latest information from the official meteorological and emergency authorities responsible for your location.
Satellite images are evidence, not predictions
A typhoon satellite image is best understood as a photograph made from measurements. It can reveal the storm's current shape, cloud-top patterns, eye, eyewall, and rainband structure. A sequence can reveal movement and reorganization.
What it cannot do by itself is tell you precisely where the cyclone will go, when conditions will deteriorate in a particular place, or which neighborhood will experience flooding.
Typhoon Dolphin's rapid intensification made for a compelling visual event, but the most useful lesson is broader: read the structure, compare timestamps, watch the sequence, and keep observation separate from prediction.
That approach makes satellite imagery both more interesting and more honest.
Sources
- China Meteorological Administration: Typhoon bulletins and updates
- China Weather: Dolphin rapidly intensifies into a super typhoon
- Japan Meteorological Agency: Tropical cyclone names for the western North Pacific
- Japan Meteorological Agency: How to read satellite imagery
- NOAA NESDIS: A guide to understanding hurricane satellite images
The cover image is an original illustration of a typical intense typhoon structure. It is not an archived observation of Typhoon Dolphin at a specific time.
Download LiveAtlas
Want to keep current Earth imagery and active tropical cyclones visible on your Mac desktop? Download LiveAtlas from the Mac App Store:
https://apps.apple.com/app/apple-store/id6762602057?pt=126396815&ct=blog_story&mt=8